Paired T Test: A Complete Guide with Formula, Examples, and Applications


Introduction
One of the most commonly used statistical tests to compare two sets of observations is the Paired T Test. The Paired T Test is used by researchers, students, healthcare professionals and business analysts to see if the average difference between two measurements is statistically significant. This statistical technique can offer reliable insights whether you're assessing patient results prior to and after treatment, comparing worker performance prior to and after training, or in measuring customer contentment over time.
Our statistical experts and analysts can assist researchers in conducting a proper hypothesis testing with the latest SPSS, R, SAS, Stata, Python, and Minitab software. Each Paired T Test analysis is performed accurately and accurately interpreted by our team.
What is a Paired T Test?
Many researchers ask, what is a paired t test?
A Paired T Test is a statistical hypothesis test for comparing the means of two related or dependent samples. A paired sample t test is similar to an independent t test, but it is used to compare measurements obtained from the same subjects in two different conditions.
Examples include:
Before and after a medical treatment
Student scores before and after coaching
Employee productivity before and after training
Machine performance before and after maintenance
Customer satisfaction before and after service improvements
The purpose of the Paired T Test is to determine whether the observed differences are statistically significant or simply due to random variation.
When Should You Use a Paired Sample T Test?
A paired sample t test should be used when:
The same participants are measured twice.
Observations are dependent.
Data is continuous.
Differences between paired observations are approximately normally distributed.
The samples are randomly selected.
When you use the right statistical method, your research results are valid and scientifically reliable.
Paired T Test Formula
The paired t test formula expresses the mean difference of paired observations as a function of the difference of the observations.
Paired T Test Formula
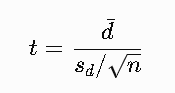
d̄ = Mean of the differences
sd = Standard deviation of the differences
n = Number of paired observations
t = Calculated t-statistic
The paired t test formula helps determine whether the difference between two related samples is statistically significant.
Paired T Test Example
Understanding a paired t test example makes the concept much easier.
Suppose a researcher wants to evaluate whether a training program improves employee productivity.
The productivity scores are measured before and after training.
Employee | Before Training | After Training | Difference |
1 | 68 | 75 | 7 |
2 | 72 | 78 | 6 |
3 | 70 | 76 | 6 |
4 | 65 | 72 | 7 |
5 | 74 | 81 | 7 |
The researcher applies the Paired T Test using statistical software. If the calculated p-value is less than 0.05, the improvement is considered statistically significant.
This paired t test example illustrates how paired observations are compared to identify meaningful changes.
Assumptions of the Paired T Test
Before performing a Paired T Test, ensure the following assumptions are satisfied:
Data consists of paired observations.
Variables are measured on an interval or ratio scale.
Differences between paired values are approximately normally distributed.
Pairs are selected independently.
No significant outliers exist in the difference scores.
Meeting these assumptions improves the accuracy of statistical conclusions.
Advantages of Using the Paired T Test
The Paired T Test offers several important advantages:
Reduces variability because the same participants are measured twice.
Increases statistical power.
Easy to perform using statistical software.
Suitable for clinical, academic, industrial, and business research.
Provides accurate comparison of related observations.
Because individual differences are controlled, the Paired T Test often produces more precise results than independent sample tests.
Applications of the Paired T Test
The Paired T Test is widely applied across different industries.
Healthcare
Researchers compare patient health indicators before and after treatment.
Clinical Research
Clinical trials evaluate medication effectiveness using repeated measurements.
Education
Teachers compare student performance before and after instructional interventions.
Manufacturing
Quality engineers assess product quality before and after process improvements.
Marketing
Businesses compare customer satisfaction before and after launching a campaign.
Finance
Financial analysts compare investment returns before and after market events.
Software Used for Paired T Test Analysis
Modern statistical software makes performing a Paired T Test quick and accurate.
Popular tools include:
IBM SPSS Statistics
R Programming
SAS
Stata
Python
Minitab
Microsoft Excel
At Simbi Labs, we use these industry-standard tools to deliver precise statistical analysis for research projects, dissertations, business analytics, and healthcare studies.
Common Mistakes to Avoid
Researchers often make mistakes while performing a Paired T Test.
Avoid these common errors:
Using unrelated samples instead of paired observations.
Ignoring normality assumptions.
Choosing the wrong statistical test.
Misinterpreting the p-value.
Failing to identify outliers.
Reporting incomplete statistical results.
Proper statistical guidance ensures valid research conclusions.
Why Choose Simbi Labs?
Simbi Labs offers thorough statistics analysis services to researchers, students, universities, healthcare institutions and businesses.
Our services include:
Paired T Test analysis
Independent T Test
ANOVA
Regression Analysis
Correlation Analysis
Chi-Square Test
Factor Analysis
Structural Equation Modeling (SEM)
Data Cleaning
Data Visualization
Research Report Writing
We have experts in statistics who provide precise results and comprehensive interpretations that are appropriate for publications, dissertations, journal articles and business reports.
Conclusion
The Paired T Test is one of the most important statistical methods used for comparing two related measurements. Whether you're researching a medical condition, conducting academic studies, or performing quality improvement projects or business performance analysis, learning what a paired t test is, the formula of a paired t test and a paired sample t test example, and knowing how to use a paired sample t test correctly could enhance the quality of your research.
Simbi Labs provides professional help for statistical analysis, hypothesis testing, data analysis and interpretation, using statistical software packages recognized throughout the world. Our expert team assures the accuracy, reliability, and customization of all analyses to meet your research needs.
Book a free consultation for appointment
Call Now : +91 99505 66669
Email : grow@simbi.in


Comments